This is a quite nice retrospective method I learned from agile42. Prepare the definition of done of your team by writing each point on a single line and put three columns besides every point. Paint the columns in red, yellow and green. The now colored columns stand for "We did that well" (green), "We did that ok" (yellow), "We didn't to that very good" (red).
In the retrospective every team member puts a dot in the colored column expressing his view on how good the team applied this point of the DoD. The result looks like this:
Now you can pick the 3 points with the lowest overall rating, discuss them (20 min timebox each) and develop optimisations for them.
You can do the same for your working agreements.
Friday, November 2, 2012
Tuesday, August 28, 2012
The Definition of done workshop
Recently one team I take care of as a Scrum Master needed a Definition of Done. Since I couldn't find anything on the internet about a corresponding workshop or a good method to create a definition, I created a workshop based on the "Challenge Cards" method from the book "Gamestorming" (page 158). Here's how you do it:
Time needed:
About 30 - 60 minutes
Preparation:
Prepare green and red colored post its and a blank flip chart (or similar).
How to play:
Divide the team into two groups. One group is the problem group, they get the red post its. The other group is the DoD group, they get the green post its. Now give both groups 10 minutes time.
Ask the problem group to think of common problems the team encounters regarding development, which could be fixed by a definition of done. Examples would be "a lot of bugs", "released version doesn't work" or "duplicate data appears". Important: Point out that it's not about problems the team can't be made responsible for (kernel panic on a server for instance), but that it's about problems that occur due to errors made during development.
Ask the DoD group to come up with possible items for a definition of done. This can be anything they can think of.
After the 10 minutes, ask the problem group to post their first problem on the left side of the flip chart. Now ask the DoD group to post one or more items that can solve this one problem on the right side of the flip chart. Let them draw an arrow going from the DoD item(s) to the problem post it. Notice that there can be more than one DoD items solving a problem and that one DoD item can solve multiple problems. It is ok and desirable to draw arrows from already posted DoD items to a new problem.
Continue until all the problems have been posted.
Now there are 3 possible outcomes:
You still have DoD items left.
Ask the DoD group to post them on the flip chart. After that, ask the whole team if they can think of more items they would like to include on the definition of done.
You still have problems that don't have a possible solution.
Ask the whole team if they can think of anything solving it. After that, ask the whole team if they can think of more items they would like to include on the definition of done.
Every problem has at least one possible solution.
Ask the whole team if they can think of more items they would like to include on the definition of done.
As a last step go over all the DoD items that have been posted on the flipchart during the workshop and ask the team if this item makes sense on a definition of done and if they agree, if this item lands on the definition of done.
Example:
Our result looked like this
Time needed:
About 30 - 60 minutes
Preparation:
Prepare green and red colored post its and a blank flip chart (or similar).
How to play:
Divide the team into two groups. One group is the problem group, they get the red post its. The other group is the DoD group, they get the green post its. Now give both groups 10 minutes time.
Ask the problem group to think of common problems the team encounters regarding development, which could be fixed by a definition of done. Examples would be "a lot of bugs", "released version doesn't work" or "duplicate data appears". Important: Point out that it's not about problems the team can't be made responsible for (kernel panic on a server for instance), but that it's about problems that occur due to errors made during development.
Ask the DoD group to come up with possible items for a definition of done. This can be anything they can think of.
After the 10 minutes, ask the problem group to post their first problem on the left side of the flip chart. Now ask the DoD group to post one or more items that can solve this one problem on the right side of the flip chart. Let them draw an arrow going from the DoD item(s) to the problem post it. Notice that there can be more than one DoD items solving a problem and that one DoD item can solve multiple problems. It is ok and desirable to draw arrows from already posted DoD items to a new problem.
Continue until all the problems have been posted.
Now there are 3 possible outcomes:
You still have DoD items left.
Ask the DoD group to post them on the flip chart. After that, ask the whole team if they can think of more items they would like to include on the definition of done.
You still have problems that don't have a possible solution.
Ask the whole team if they can think of anything solving it. After that, ask the whole team if they can think of more items they would like to include on the definition of done.
Every problem has at least one possible solution.
Ask the whole team if they can think of more items they would like to include on the definition of done.
As a last step go over all the DoD items that have been posted on the flipchart during the workshop and ask the team if this item makes sense on a definition of done and if they agree, if this item lands on the definition of done.
Example:
Our result looked like this
Tuesday, August 14, 2012
A different kind of retrospective: Story workshop
Yesterday I tried a different kind of retrospective: The story workshop. Instead of writing post-its answering "What was good?"/"What went wrong?" or Mad/Sad/Glad, you ask the team to do the following:
"Write a short story, a movie, a play or a comic about the last sprint"
The feedback from the attendees was very positive, the main statement being that you get a quite different look on the past sprint, when you try to draw it (everyone in the retrospective drew a comic).
One of the comics looked like this:
Wednesday, July 25, 2012
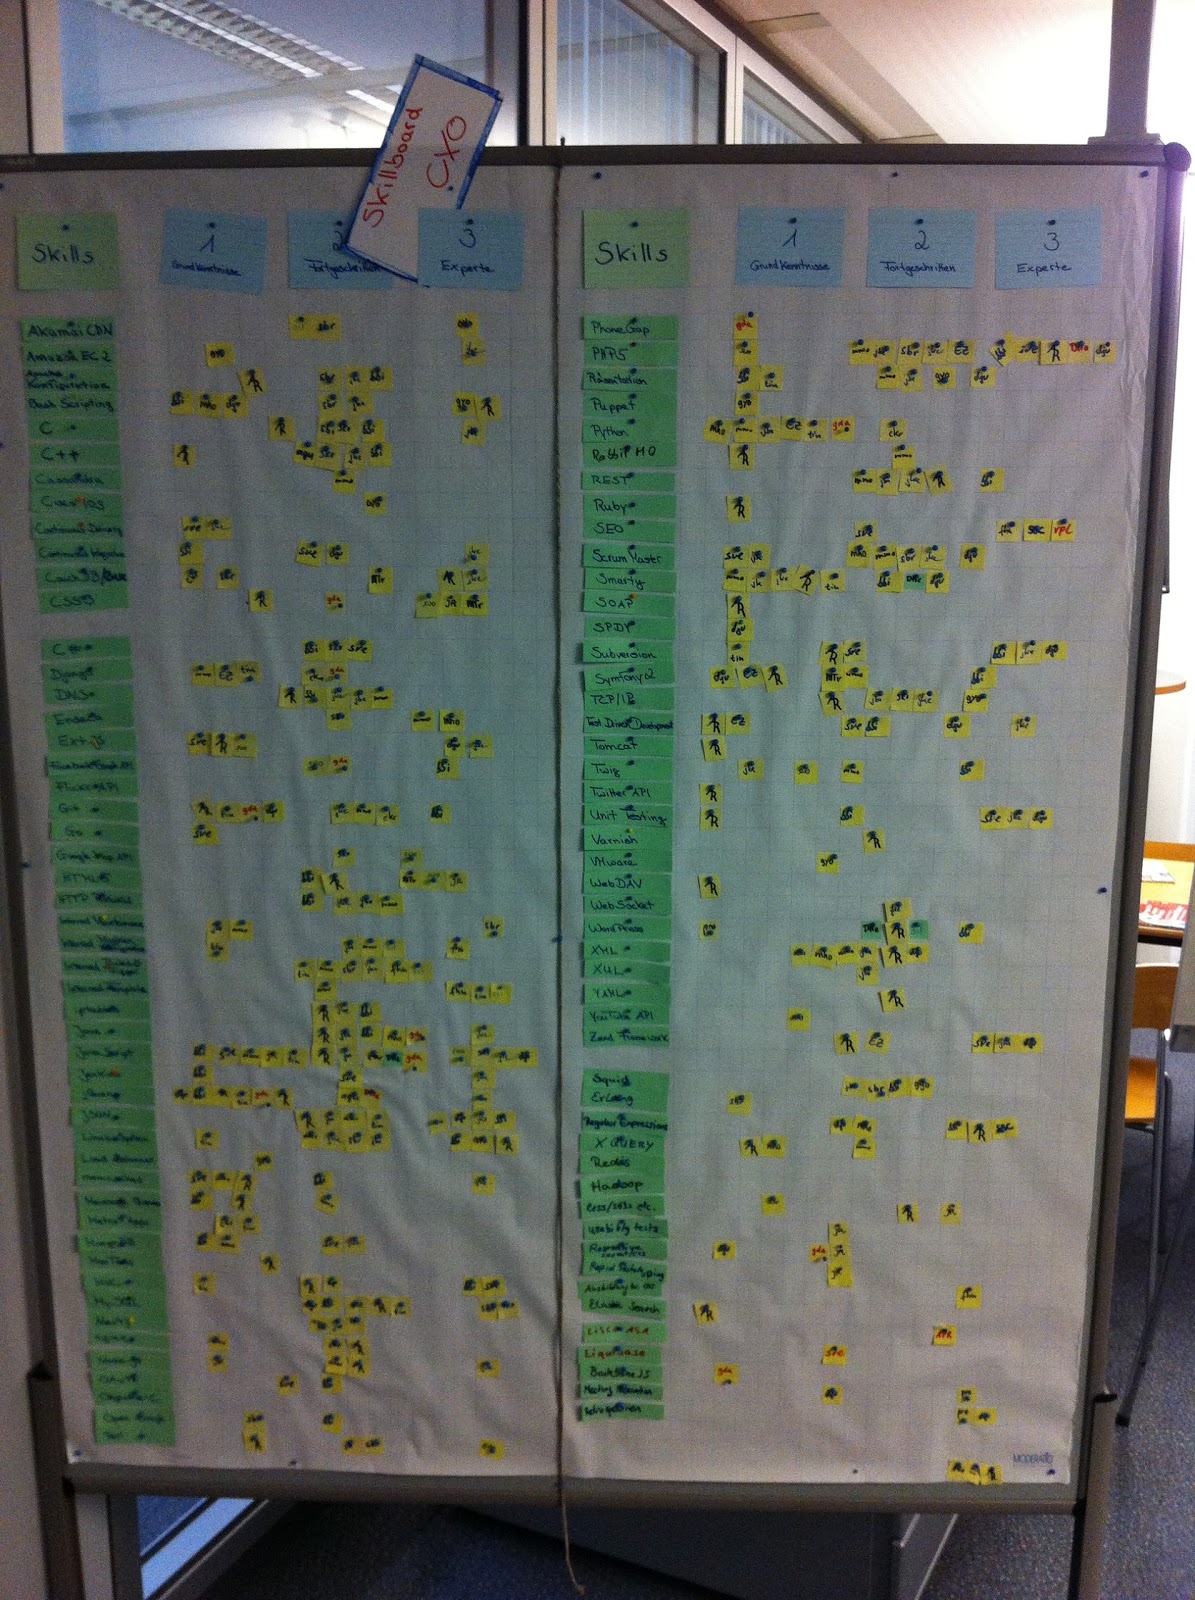
Skillboard
Here at CHIP Online we introduced a Skillboard a short while ago. We did this, because we realized that it's hard to keep track of who knows what the larger the company gets.
The skillboard itself is quite easy: You put the skills in the rows (like PHP5, NoSQL or Meeting Moderation) and each row has 3 columns: Basic, Advanced, Pro. These 3 columns represent the knowledge state. Now everyone has the opportunity to put his name at the proper position: Which skill do I have at what level. If you're pro at PHP5, simply put your name in the pro column of the PHP5 row.
The advantage of this skillboard is: If anyone needs help with any technology, he/she can take a look at the skillboard and see if someone in the company has knowledge of it.
The skillboard itself is quite easy: You put the skills in the rows (like PHP5, NoSQL or Meeting Moderation) and each row has 3 columns: Basic, Advanced, Pro. These 3 columns represent the knowledge state. Now everyone has the opportunity to put his name at the proper position: Which skill do I have at what level. If you're pro at PHP5, simply put your name in the pro column of the PHP5 row.
The advantage of this skillboard is: If anyone needs help with any technology, he/she can take a look at the skillboard and see if someone in the company has knowledge of it.
Saturday, June 9, 2012
Different estimation methods compared
A while ago, I conducted a workshop about agile estimation. In this workshop, I showed the participants three (of many) different ways of estimation: Planning Poker, Magic Estimation and the Team Estimation Game.
Planning Poker [Interaction level: high]
Probably the classic estimation method. The product owner reads a user story, the team estimates using the planning poker cards. If there are any differences in the estimation, the team starts a short discussion about everyones different opinion of the story at hand. If after about 3 estimation rounds there is still no consensus, the story is obviously not clear enough and everyone tries to gather new information until the next estimation session. Planning Poker usually uses story points, although I've already seen cards with animals on it (quite a nice idea actually). The estimation session ends when either all the stories are estimated or when time is up.
At the workshop I let the participants estimate what it takes to clean a kitchen. During estimation the team realized, that story #1 and #4 are too large and split them up to 2 and 3 stories.
Magic Estimation [Interaction level: low - medium]
Probably the second classic estimation method. Prepare a flipchart (or similar) where you draw an arrow going up (symbolizing the increased complexity) and write your references beside the arrow, be it user stories, T-Shirt size or whatever you feel most comfortable with. The product owner reads a user story, writes it on a post-it and puts the post-it on the flipchart. This procedure is repeated for about 5 stories. The team then gets 2 minutes to stand in front of the flipchart and silently move the post-its to where it thinks they belong. If during the 2 minutes you realize, that a story is wandering around a lot, you might want to talk about some details after the 2 minutes. This whole procedure is repeated until there are no stories left or the time is up.
At the workshop the result looked like this:
Team Estimation Game [Interaction level: low]
An estimation method I found a while ago here (page is in german) and have used at the workshop myself for the first time. This method is quite similar to magic estimation. As with magic estimation you need a flipchart prepared. The product owner brings all the stories on index cards to the estimation and lays them, heads down, on a table. Someone from the team (whoever wants to go first), takes the first story card, reads it out aloud and then puts it on the flipchart where ever he/she thinks it belongs. Now the second one in the team pulling a card can either put it besides, above or below the first story read. From the third story on, every team member has 3 possibilities for his move:
Conclusion:
In my time as a developer I only used planning poker (apart from any workshops or similar I attended). After having conducted this workshop, I still prefer planning poker over magic estimation and team estimation, since the interaction with planning poker is way higher than with the other two (which is also the conclusion of the workshop participants). That doesn't render magic estimation and team estimation totally useless, there are still valid use cases for them. They are actually quite useful when you need a lot stories estimated in a short time, e.g. at the beginning of a project. Other than that my favorite remains planning poker.
Planning Poker [Interaction level: high]
Probably the classic estimation method. The product owner reads a user story, the team estimates using the planning poker cards. If there are any differences in the estimation, the team starts a short discussion about everyones different opinion of the story at hand. If after about 3 estimation rounds there is still no consensus, the story is obviously not clear enough and everyone tries to gather new information until the next estimation session. Planning Poker usually uses story points, although I've already seen cards with animals on it (quite a nice idea actually). The estimation session ends when either all the stories are estimated or when time is up.
At the workshop I let the participants estimate what it takes to clean a kitchen. During estimation the team realized, that story #1 and #4 are too large and split them up to 2 and 3 stories.
Magic Estimation [Interaction level: low - medium]
Probably the second classic estimation method. Prepare a flipchart (or similar) where you draw an arrow going up (symbolizing the increased complexity) and write your references beside the arrow, be it user stories, T-Shirt size or whatever you feel most comfortable with. The product owner reads a user story, writes it on a post-it and puts the post-it on the flipchart. This procedure is repeated for about 5 stories. The team then gets 2 minutes to stand in front of the flipchart and silently move the post-its to where it thinks they belong. If during the 2 minutes you realize, that a story is wandering around a lot, you might want to talk about some details after the 2 minutes. This whole procedure is repeated until there are no stories left or the time is up.
At the workshop the result looked like this:
Team Estimation Game [Interaction level: low]
An estimation method I found a while ago here (page is in german) and have used at the workshop myself for the first time. This method is quite similar to magic estimation. As with magic estimation you need a flipchart prepared. The product owner brings all the stories on index cards to the estimation and lays them, heads down, on a table. Someone from the team (whoever wants to go first), takes the first story card, reads it out aloud and then puts it on the flipchart where ever he/she thinks it belongs. Now the second one in the team pulling a card can either put it besides, above or below the first story read. From the third story on, every team member has 3 possibilities for his move:
- Read the next story card and put it on the flipchart
- Reassign a story already on the flipchart, also explaining why he does that
- Skip
When reassigning a story, you might also mark the story with a dot. The more dots a story gets, the more opinions about it differ and you should discuss it in detail. Like with the two other estimation methods, the team estimation game ends when there are no more stories left or when time is up.
At the workshop the result of the team estimation game looked similar to magic estimation:
Conclusion:
In my time as a developer I only used planning poker (apart from any workshops or similar I attended). After having conducted this workshop, I still prefer planning poker over magic estimation and team estimation, since the interaction with planning poker is way higher than with the other two (which is also the conclusion of the workshop participants). That doesn't render magic estimation and team estimation totally useless, there are still valid use cases for them. They are actually quite useful when you need a lot stories estimated in a short time, e.g. at the beginning of a project. Other than that my favorite remains planning poker.
Saturday, June 2, 2012
On conferences
You can catch me next week (June 4rd - June 6th) at the International PHP Conference 2012 Spring Edition. I will be speaking at the agile day about "The five dysfunctions of a team" and - if you do speak german - about "Stolpersteine agiler Methoden" together with Sebastian Bauer.
Hope to see you there!
Friday, May 4, 2012
Histogram: Team communication
Based on the satisfaction histogram from "Agile Retrospectives - Making good teams great" (p. 64 - 67), I did a communication satisfaction histogram in our last retrospective.
To measure how the team thinks about the communication between each other they could choose between 5 states:
"The communication in our team is ..."
To measure how the team thinks about the communication between each other they could choose between 5 states:
"The communication in our team is ..."
- 5: ... outstanding
- 4: ... mostly very good
- 3: ... satisfactory, but needs to be improved
- 2: ... bad and needs to be improved badly
- 1: ... a disaster
Team members vote anonymously, for scoring you can use dots:
I also left some space for further comments (write them on Post-Its and put them on the flipchart).
Subscribe to:
Posts (Atom)